Michigan Energy Infrastructure & Population Density Map
datasetMulti-layer geospatial visualization of Michigan's energy infrastructure overlaid on Census population density, with a data center siting score for all 1,580 county subdivisions
A high-resolution, multi-layer map of Michigan’s energy infrastructure overlaid on Census tract population density, plus a composite Data Center Siting Score ranking all 1,580 county subdivisions for hyperscale development potential.
Download full vector PDF (infinite zoom)
Map Layers
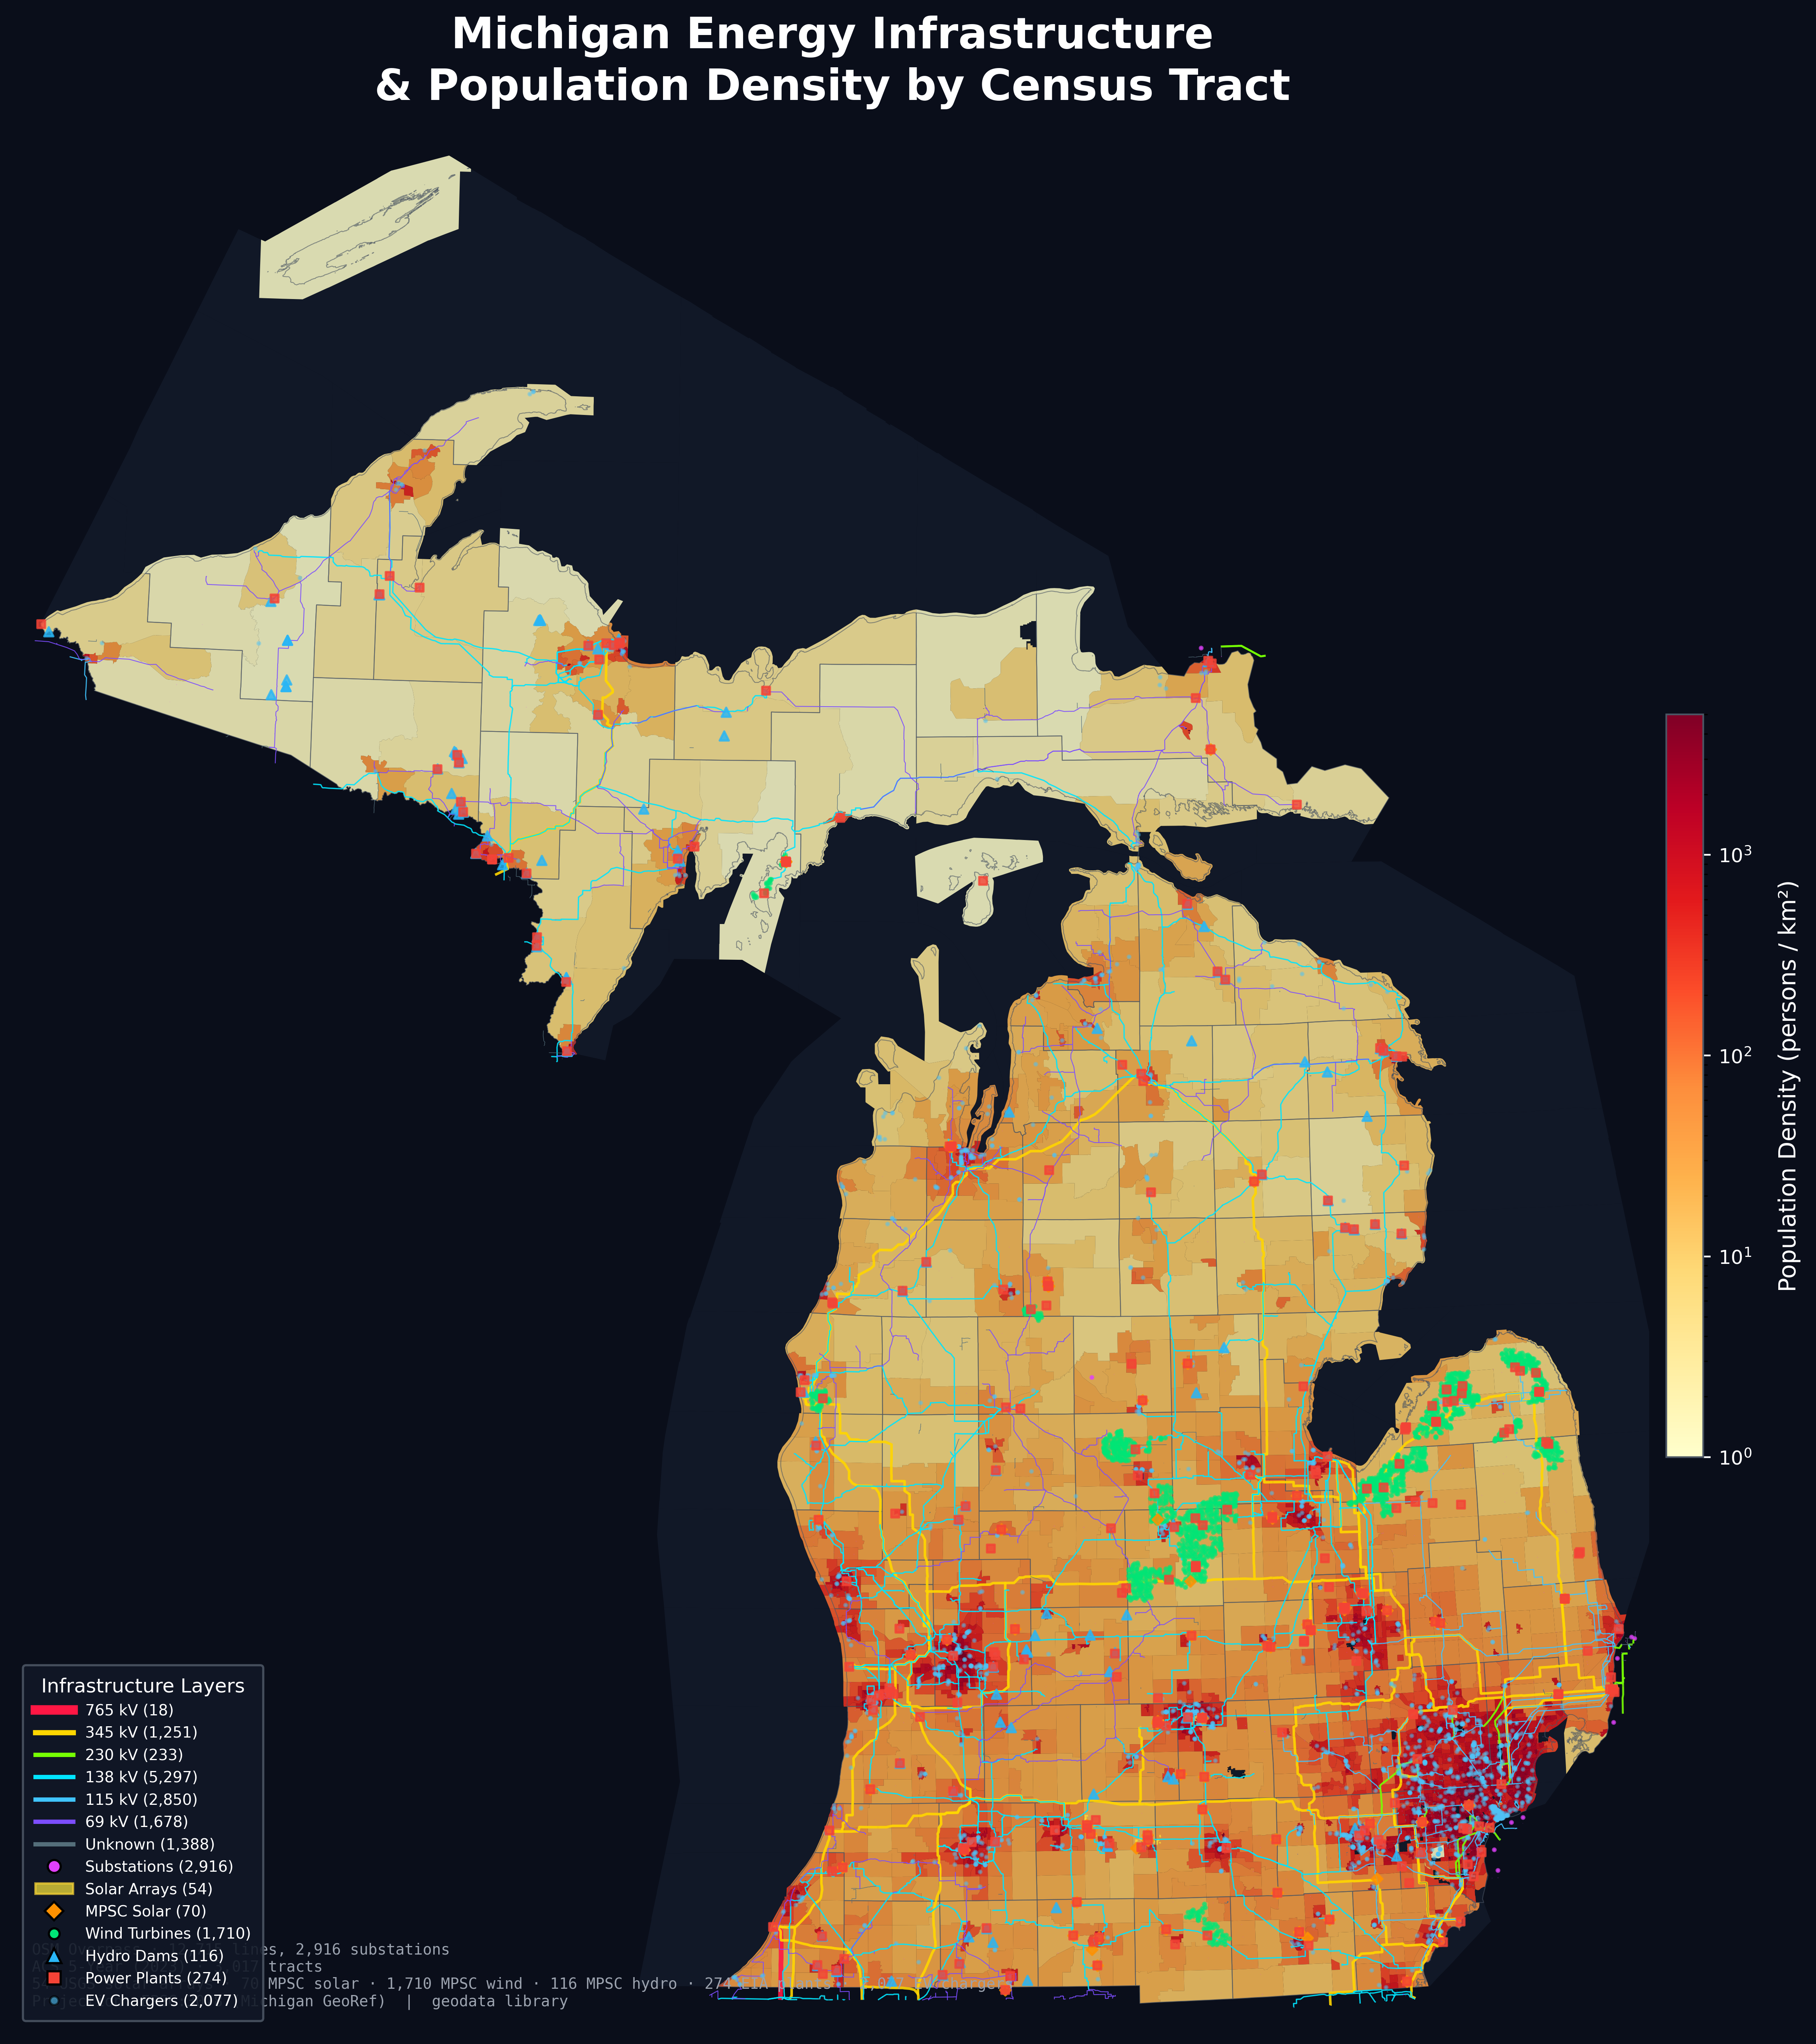
The map renders 10 infrastructure layers projected onto Michigan GeoRef (EPSG:3078):
| Layer | Source | Features |
|---|---|---|
| Population density choropleth | ACS 5-Year (2023) | 3,017 tracts |
| County boundaries | Census TIGER | 83 counties |
| Transmission lines (by voltage class) | OpenStreetMap Overpass | 21,936 lines |
| Substations (sized by voltage) | OpenStreetMap Overpass | 4,887 substations |
| USGS solar array footprints | USGS | 54 arrays |
| MPSC solar projects | MI Public Service Commission | 70 projects |
| MPSC wind turbines | MI Public Service Commission | 1,710 turbines |
| MPSC hydro dams | MI Public Service Commission | 116 dams |
| EIA power plants | US Energy Information Administration | 274 plants |
| EV charging stations | NREL AFDC | 2,078 stations |
Data Center Siting Score
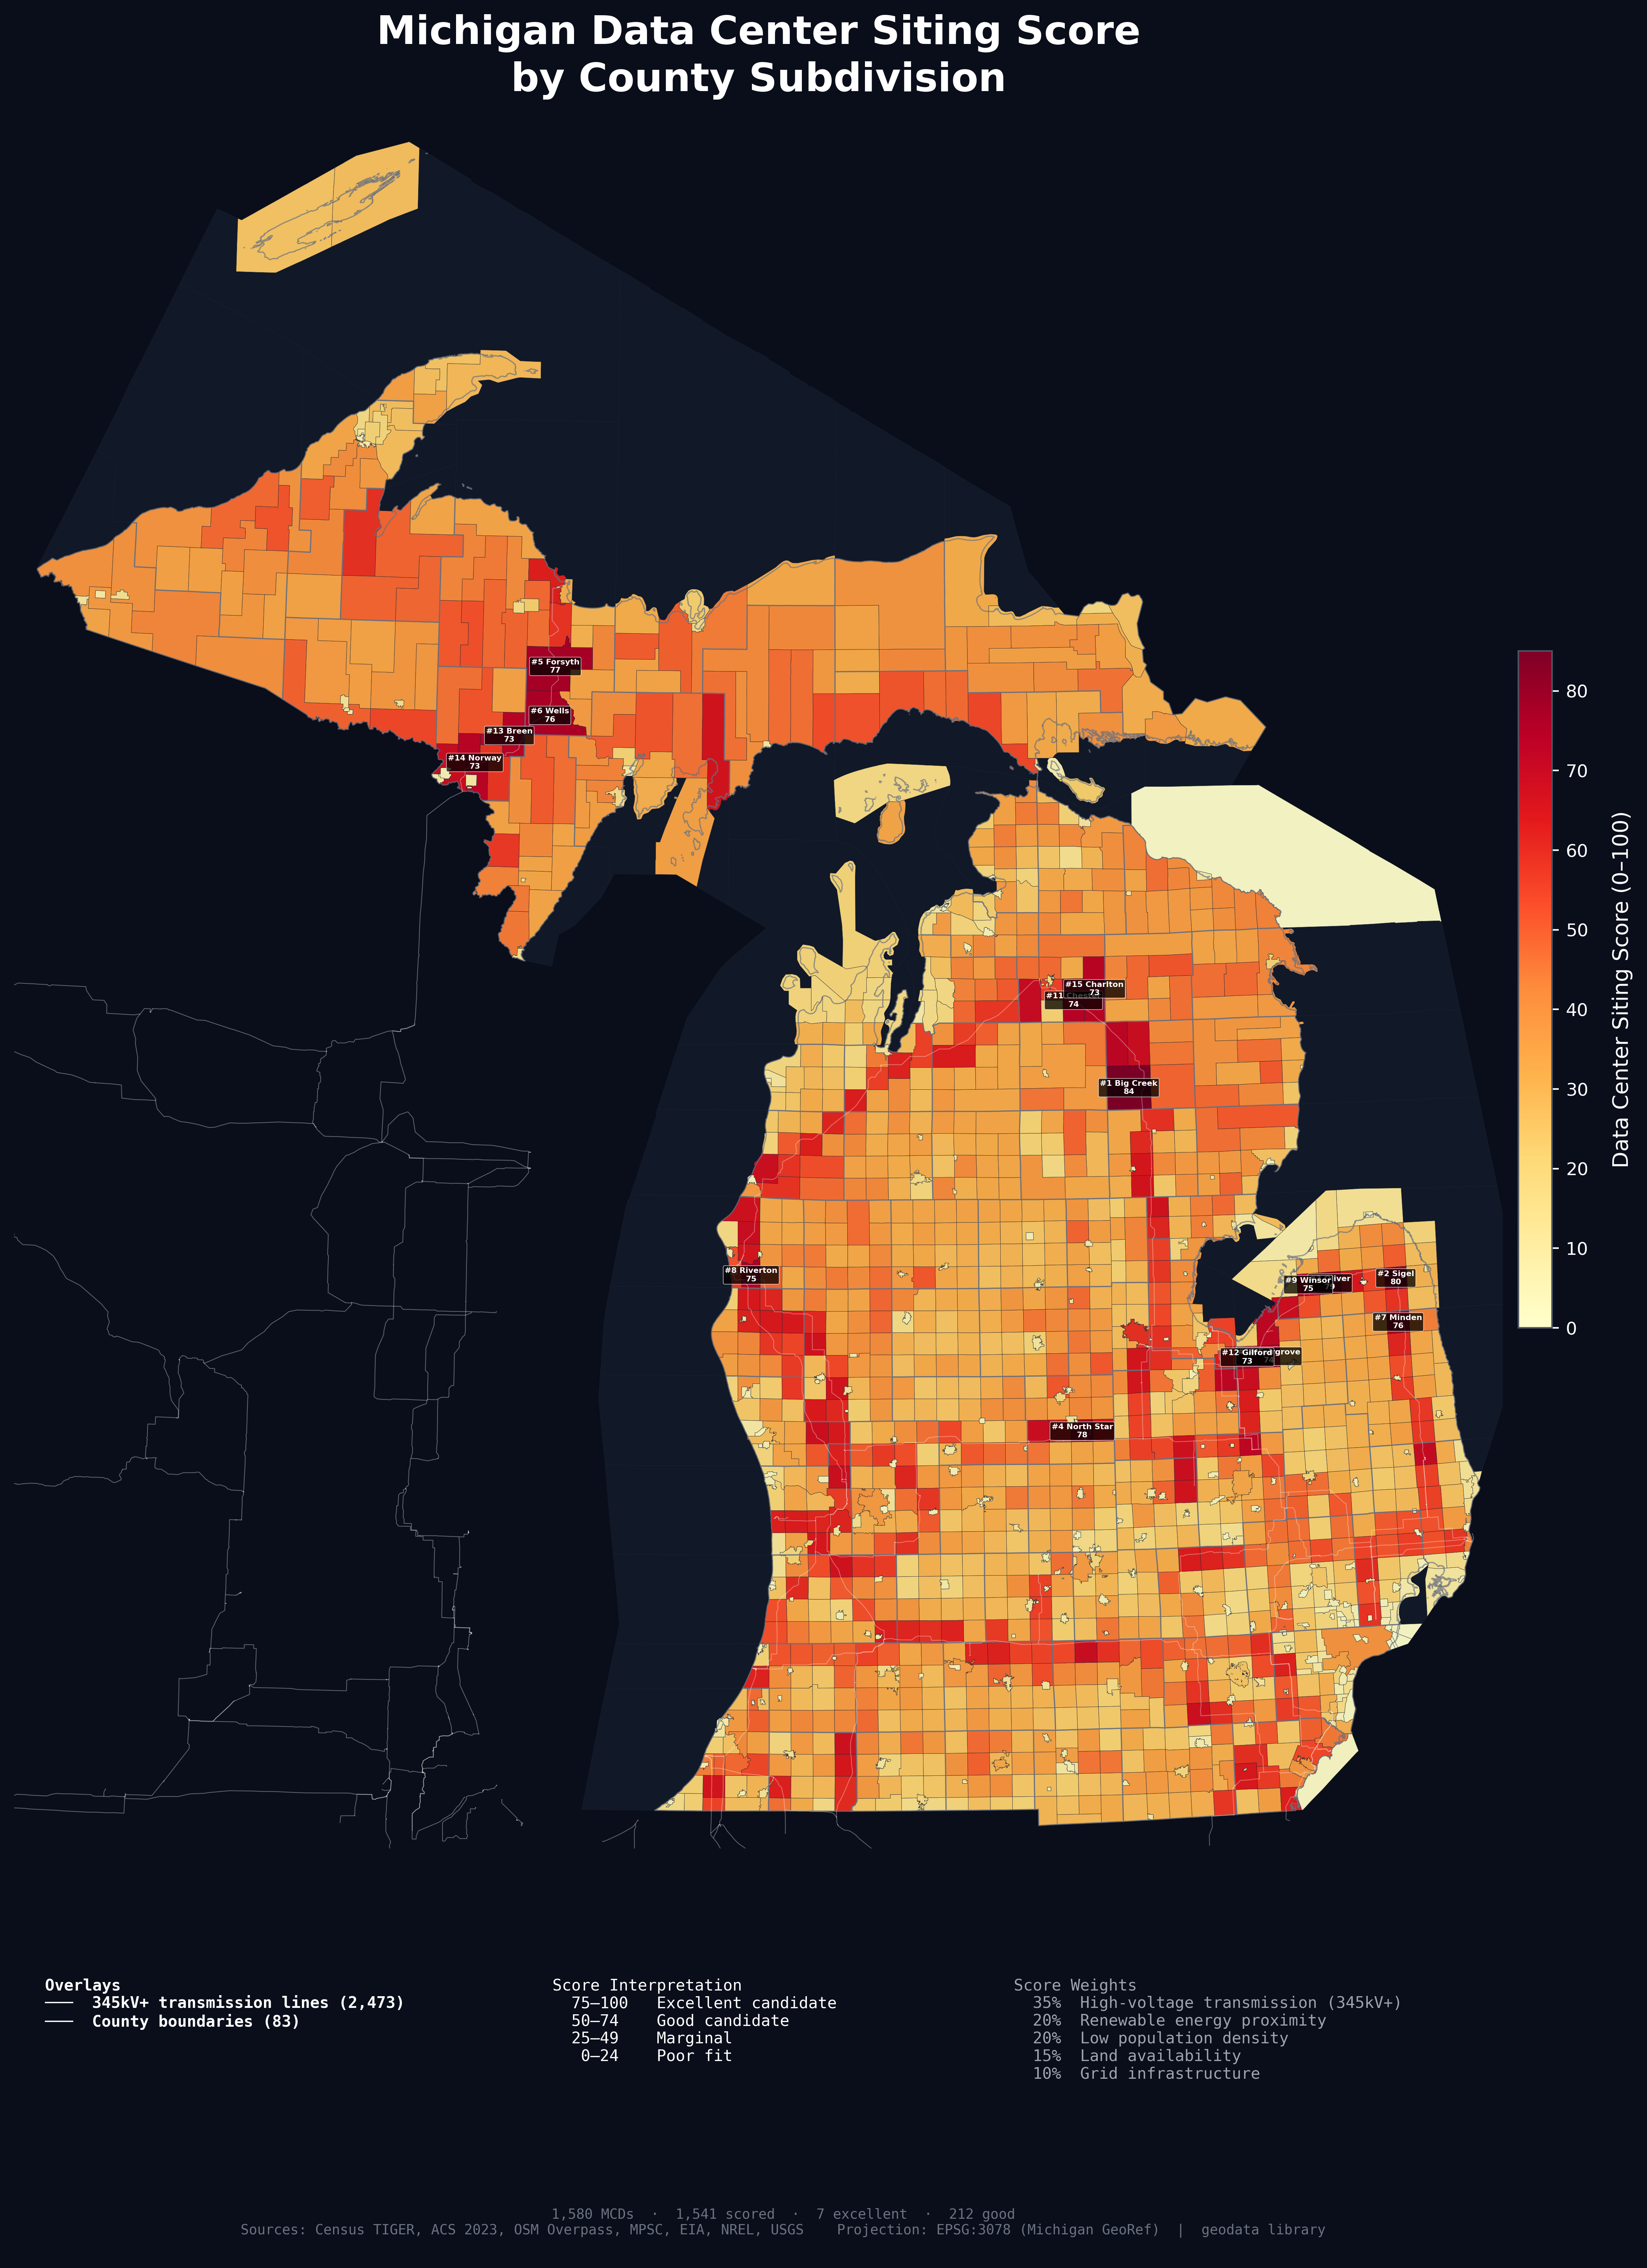
Each of Michigan’s 1,580 county subdivisions (townships, cities, charter townships) is scored 0—100 across five weighted dimensions:
| Dimension | Weight | What It Captures |
|---|---|---|
| High-voltage transmission | 35% | 345kV+ and 138—344kV line access |
| Renewable energy proximity | 20% | Nearby wind, solar, and generation |
| Low population density | 20% | Inverse density (rural = higher) |
| Land availability | 15% | Large parcels, low water fraction |
| Grid infrastructure | 10% | Substations and transmission density |
Top 10 MCDs by Siting Score
| Rank | Township | Score | Pop. | 345kV+ (km) | Wind | Substations |
|---|---|---|---|---|---|---|
| 1 | Big Creek township | 84.5 | 2,943 | 20.8 | 0 | 3 |
| 2 | Sigel township | 80.0 | 523 | 16.1 | 24 | 5 |
| 3 | Oliver township | 78.7 | 816 | 10.6 | 57 | 5 |
| 4 | North Star township | 77.8 | 803 | 18.0 | 39 | 3 |
| 5 | Forsyth township | 76.8 | 5,032 | 23.3 | 0 | 4 |
| 6 | Wells township | 76.0 | 846 | 25.7 | 0 | 2 |
| 7 | Minden township | 75.5 | 558 | 10.1 | 25 | 3 |
| 8 | Riverton township | 74.7 | 1,692 | 13.1 | 46 | 1 |
| 9 | Winsor township | 74.6 | 1,008 | 8.9 | 61 | 6 |
| 10 | Fairgrove township | 74.3 | 1,017 | 14.2 | 62 | 4 |
Top-scoring areas cluster in the Thumb region and central Michigan wind corridor --- rural townships with extensive 345kV+ transmission and active wind generation.
Siting Score Choropleth
Download siting score vector PDF (infinite zoom)
Data Pipeline
Built with geodata, a Python library for geographic data retrieval with provenance tracking.
Retrieval
Each data source is registered as a DataSource subclass with standardized retrieve() methods. Sources include ArcGIS REST pagination, Census TIGER shapefiles, OpenStreetMap Overpass QL, NREL APIs, and Census ACS. Every output file gets a .provenance.json sidecar with SHA-256 hash, source URL, and retrieval timestamp.
Spatial Enrichment
The enrichment pipeline (scripts/enrich_mcd_infrastructure.py) performs:
- Point-in-polygon counts --- sjoin for wind turbines, solar projects, hydro dams, power plants, EV chargers, and substations
- Line-polygon overlay --- transmission line length by voltage class (345kV+, 138—344kV, 69—137kV, <69kV)
- Polygon-polygon overlay --- solar array footprint count and area
- Area-weighted population --- Census tract population apportioned to MCDs by intersection area fraction
- Composite scoring --- weighted sum across 5 dimensions with logistic density decay and city penalty
Map Rendering
The map script (scripts/map_michigan_power_demographics.py) projects all layers to EPSG:3078, clips to the state boundary, and renders with matplotlib. Transmission lines are colored by voltage class from red (765kV) through the spectrum to gray (unknown). The vector PDF preserves full detail at any zoom level.
Output Files
- Infrastructure map: PNG (400 DPI) | Vector PDF
- Siting score map: PNG (400 DPI) | Vector PDF
- Enriched data (CSV): mcd_energy_infrastructure.csv --- 1,580 rows with all infrastructure counts, transmission metrics, population estimates, and siting scores
- Source code: github.com/mjbommar/geodata
Related Work
This project provides the quantitative foundation for This Is Server Country, a 402-page investigation into America’s AI data center buildout, and Moratorium Nation, a survey of 116 data center and renewable energy moratoria across 30 states.